Abstract
We reproduced the Nucleus OnePot PURE protein mix protocol to validate the protocol and investigate the cause of low performance during the Nucleus PURE Workshop. Re-transformation of DNA from the Nucleus distribution and glucose-supplemented culture increased performance, but did not fully reach nominal PURE protein expression yield. We are continuing to investigate process and protocol improvements to increase expression yield of the protein mix.
Background
The Nucleus OnePot PURE Protocol (also available online) was released during a workshop held at Nucleus Labs from May 12th—16th where participants attempted to make all components of PURE, including protein mix, energy mix, tRNA, and ribosomes. With the exception of the protein mix, all other components exhibited a performance in PURE that matched or exceeded the benchmarks set by commercially available reagents. During the workshop, most protein mix preps had performance of ~1% of the commercially available equivalent; with debugging, some of these rose to 5%. Our strongest hypothesis for this performance was that the initial E. coli protein expression strains contained sequence errors for some proteins, or that some strains dropped out during the one pot co-culture. We set out to replicate the Nucleus OnePot protocol, particularly the production of protein mix, starting fresh from newly-transformed strains and with careful quality control on the expression strains and co-culture.
The purpose of this Developer Note is to document the process of validating the Nucleus OnePot PURE protocol and identify improvements so that the protocol delivers a performance of >80% consistently. This note will be updated periodically as we make progress. Improvements described here will be fed back into the protocol for the benefit of others.
Transformation and culture of Nucleus PURE plasmids
Transformation and outgrowth
A key potential failure mode of protein mix during the workshop was the initial culturing of the individual protein expression strains, and the one pot co-culture. Due to time, this was the one step that it was impossible to repeat, and it is also difficult to validate the DNA and protein contents of the co-culture cell pellet without running all the way through the purification process (although we are working on means to do this—watch this space). To ensure that the individual strains and co-culture weren’t the problem, we re-transformed DNA encoding the PURE proteins into NEB T7 Express lysY/lacIq from the sequence-validated plasmid stocks on the Nucleus PURE workshop plate, cultured individual overnights as described in the protocol, and re-sequenced each individual overnight strain using Plasmidsaurus’s ZeroPrep service.
In addition, we experimented with supplementing the transformation plates and overnight culture media with 1% glucose to provide even stronger repression of the plasmids, so that some of the more toxic protein products were less likely to drive mutation or plasmid dropout in the strains. We also plated and cultured overnights for the last 12 PURE proteins without glucose to compare the results; the final 12 include all of the translation-related proteins (IF, EF, etc.) and in our experience are the most toxic to E. coli when expressed.
The DNA transformed effectively—in retrospect, we would have plated at a higher dilution to be more easily able to pick individual colonies. A few constructs had low or no colonies. We suspect this is due to low input DNA concentration, either from the initial creation of the DNA distribution plate or our resuspension of the dried DNA in the wells.
Overnights were cultured in a 96-well baffled deep-well plate in 500 uL of LB + Kan media, at 37C with 250 rpm shaking. EF-Tu was separately cultured in replicate 5 mL culture tubes. After growth, we extracted 100 uL for ZeroPrep sequencing, inoculated the co-culture as described in the protocol, and created reference glycerol stocks using the remaining culture.
We inoculated the co-culture per the protocol, again splitting into two co-culture samples: -, without glucose supplementation, and +, with 1% glucose supplementation to increase pre-induction repression. Both co-cultures were performed in 500 mL TB + Kan in a 2L baffled shake flask (note the change from LB, to increase potential cell yield), incubated at 37ºC and 250 rpm, and induced with 500 uM IPTG.
Sequencing results
The sequencing results returned with almost-perfect sequences for all constructs, including those that were cultured without glucose supplementation. ArgRS has two point mutations which occur outside the coding sequence of ArgRS itself or the antibiotic resistance marker. One such mutation occurs between the rop promoter and CDS, and thus has a small likelihood of affecting plasmid copy number, however this plasmid successfully expresses ArgRS when cultured and induced individually, and so we expect the mutation does not affect performance here. All of the remaining sequences matched the expected sequence.
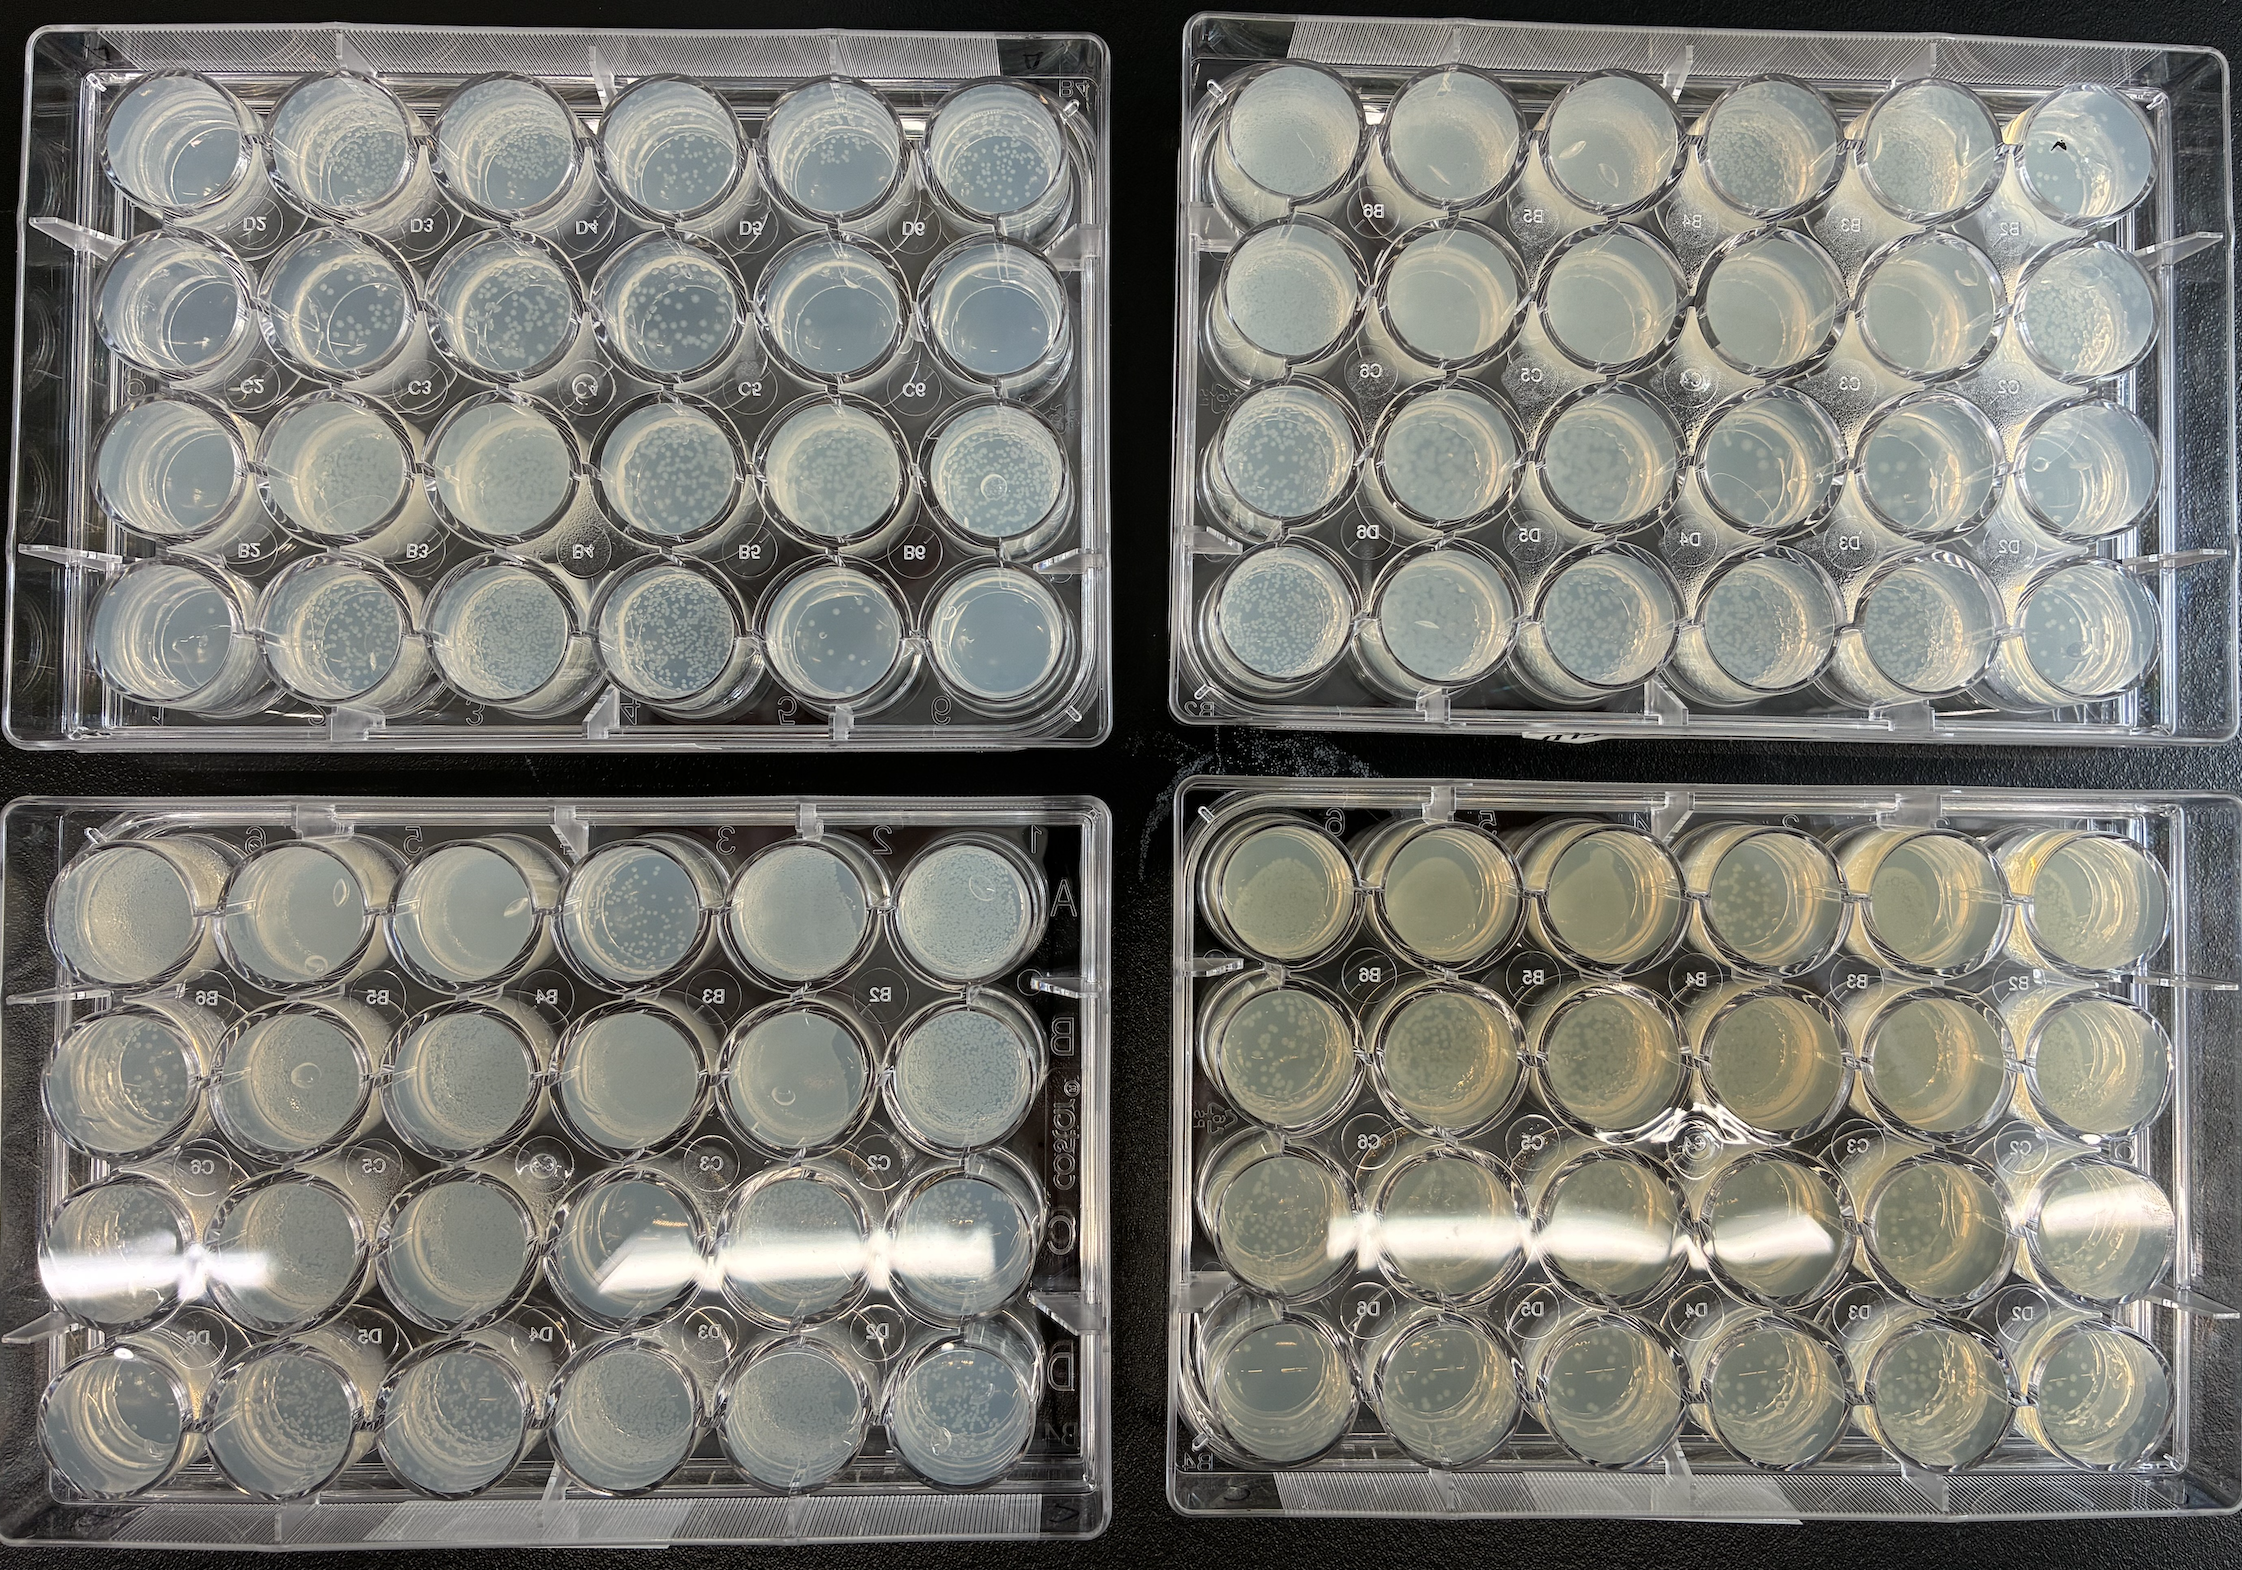
Figure 1:Photo showing NEB T7 Express lysY/lacIq Competent E. coli cells transformed with the Nucleus PURE plasmids in a 24 well format on agarose with 1% glucose. Some constructs were plated in duplicate into LB/agarose without a 1% glucose supplement (bottom right plate).
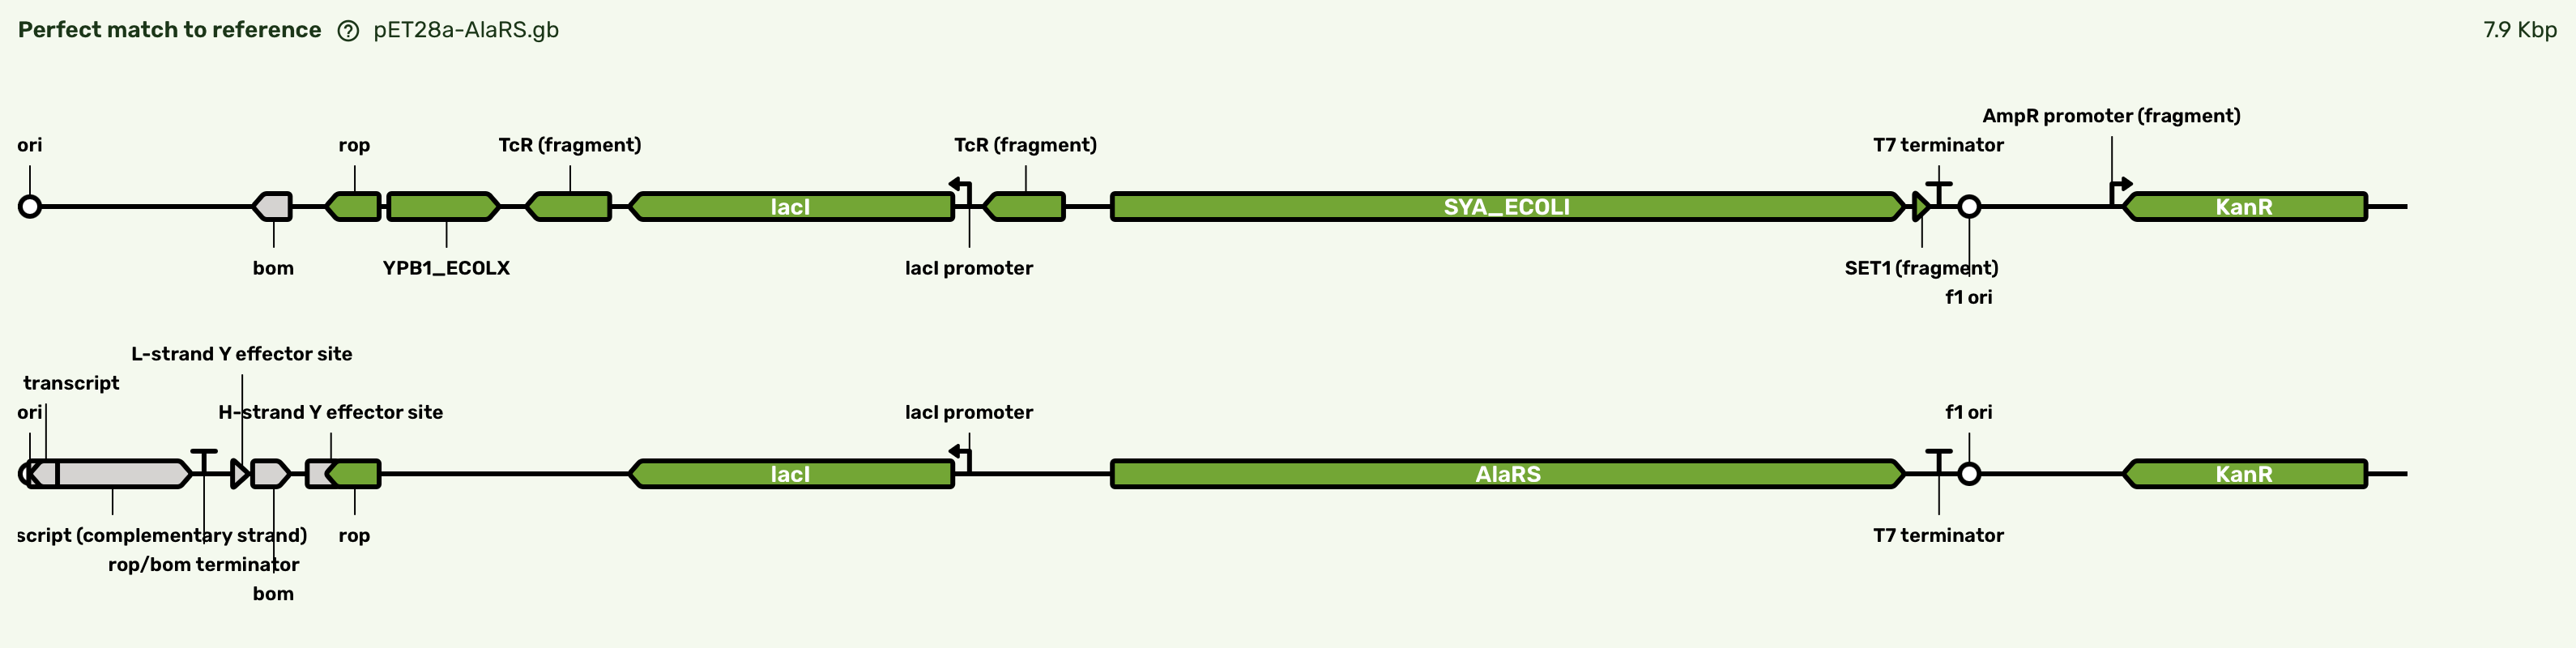
Figure 2:Representative sequence report showing the correct sequence returned for pET28a-AlaRS, analyzed in Plasmidsaurus’s built-in tools.
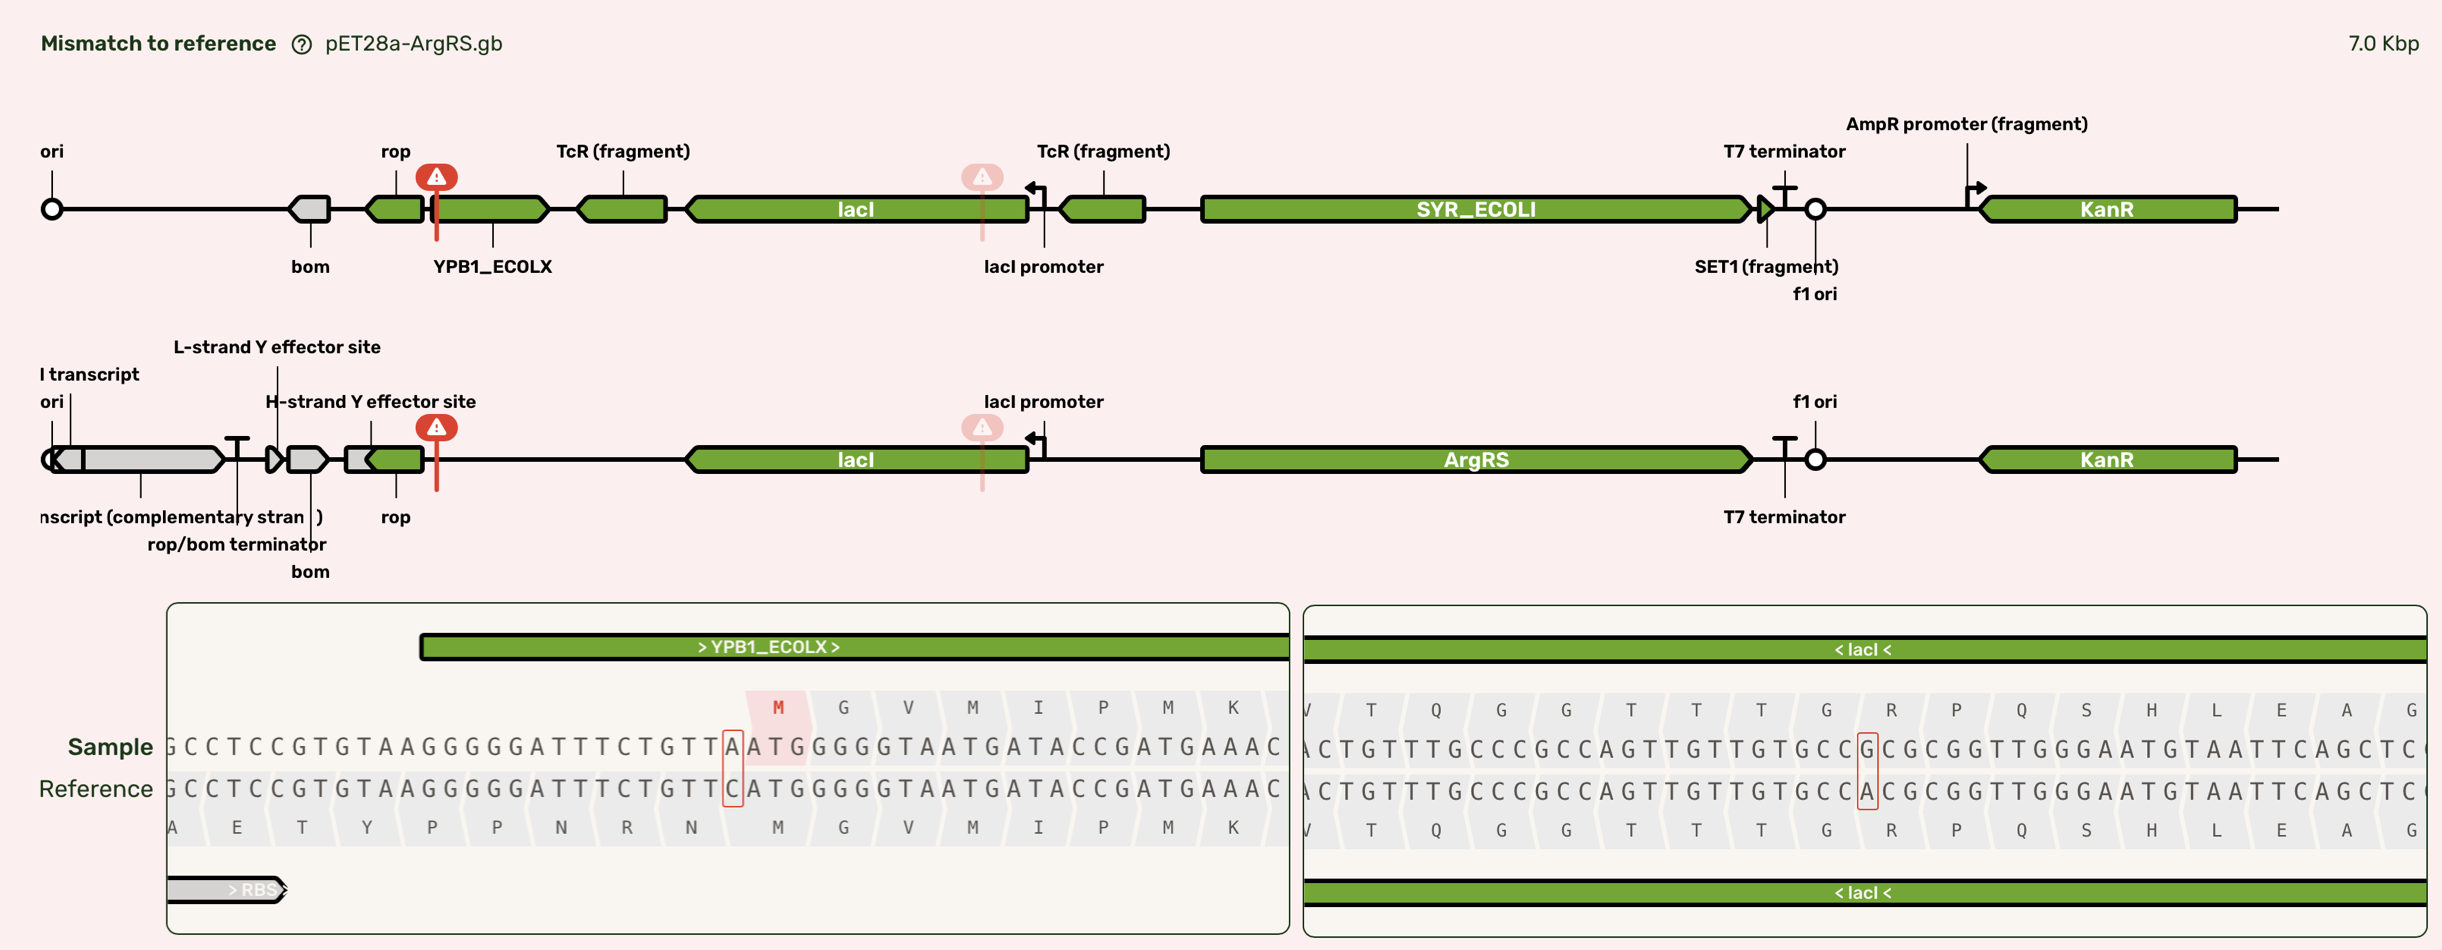
Figure 3:ArgRS sequence showing the two point mutations in the pET28a backbone of pET28a-ArgRS. One point mutation occurrs upstream of the rop coding sequence and RBS, but downstream of the predicted promoter. The other is a silent point mutation within the lacI coding sequence.
Table 1:Table showing sequencing results of plasmids sampled from transformations in Table 1. All plasmids are confirmed sequence matches by inspection.
| # | Name | Length | Reference | Status |
|---|---|---|---|---|
| 1 | AlaRS | 7.9 Kbp | pET28a-AlaRS.gb | ✅ |
| 2 | ArgRS | 7.0 Kbp | pET28a-ArgRS.gb | ⛔ |
| 3 | AsnRS | 6.6 Kbp | pET28a-AsnRS.gb | ✅ |
| 4 | AspRS | 7.0 Kbp | pET28a-AspRS.gb | ✅ |
| 5 | CysRS | 6.6 Kbp | pET28a-CysRS.gb | ✅ |
| 6 | GlnRS | 6.9 Kbp | pET28a-GlnRS.gb | ✅ |
| 7 | GluRS | 6.7 Kbp | pET28a-GluRS.gb | ✅ |
| 8 | GlyRS | 8.3 Kbp | pET28a-GlyRS.gb | ✅ |
| 9 | HisRS | 6.5 Kbp | pET28a-HisRS.gb | ✅ |
| 10 | IleRS | 8.1 Kbp | pET28a-IleRS.gb | ✅ |
| 11 | LeuRS | 7.8 Kbp | pET28a-LeuRS.gb | ✅ |
| 12 | LysRS | 6.8 Kbp | pET28a-LysRS.gb | ✅ |
| 13 | MetRS | 7.3 Kbp | pET28a-MetRS.gb | ✅ |
| 14 | PheRS | 8.6 Kbp | pET28a-PheRS.gb | ✅ |
| 15 | ProRS | 7.0 Kbp | pET28a-ProRS.gb | ✅ |
| 16 | SerRS | 6.5 Kbp | pET28a-SerRS.gb | ✅ |
| 17 | ThrRS | 7.2 Kbp | pET28a-ThrRS.gb | ✅ |
| 18 | TrpRS | 6.2 Kbp | pET28a-TrpRS.gb | ✅ |
| 19 | TyrRS | 6.5 Kbp | pET28a-TyrRS.gb | ✅ |
| 20 | ValRS | 8.1 Kbp | pET28a-ValRS.gb | ✅ |
| 21 | MTF | 6.2 Kbp | pET28a-MTF.gb | ✅ |
| 22 | IF1 | 5.5 Kbp | pET28a-IF1.gb | ✅ |
| 23 | pT5-IF2 | 7.9 Kbp | pET28a-pT5-IF2.gb | ✅ |
| 24 | IF3 | 5.8 Kbp | pET28a-IF3.gb | ✅ |
| 25 | EF-G | 7.4 Kbp | pET28a-EFG.gb | ✅ |
| 26 | EF-Tu | 6.4 Kbp | pET28a-EFTu.gb | ✅ |
| 27 | EF-Ts | 6.1 Kbp | pET28a-EFTs.gb | ✅ |
| 28 | RF1 | 6.3 Kbp | pET28a-RF1.gb | ✅ |
| 29 | RF2 | 6.3 Kbp | pET28a-RF2.gb | ✅ |
| 30 | RF3 | 6.8 Kbp | pET28a-RF3.gb | ✅ |
| 31 | RRF | 5.8 Kbp | pET28a-RRF.gb | ✅ |
| 32 | AK-Gg | 5.8 Kbp | pET28a-AK-Gg.gb | ✅ |
| 33 | CK-Gg | 6.4 Kbp | pET28a-CK-Gg.gb | ✅ |
| 34 | NDK | 5.7 Kbp | pET28a-NDK.gb | ✅ |
| 35 | PPiase | 6.1 Kbp | pET28a-PPiase.gb | ✅ |
| 36 | pT5-T7RNAP | 7.9 Kbp | pET28a | ✅ |
| 37 | EF-G-LBKAN | 7.4 Kbp | pET28a-EFG.gb | ✅ |
| 38 | EF-Tu-LBKAN | 6.4 Kbp | pET28a-EFTu.gb | ✅ |
| 39 | EF-Ts-LBKAN | 6.1 Kbp | pET28a-EFTs.gb | ✅ |
| 40 | RF1-LBKAN | 6.3 Kbp | pET28a-RF1.gb | ✅ |
| 41 | RF2-LBKAN | 6.3 Kbp | pET28a-RF2.gb | ✅ |
| 42 | RF3-LBKAN | 6.8 Kbp | pET28a-RF3.gb | ✅ |
| 43 | RRF-LBKAN | 5.8 Kbp | pET28a-RRF.gb | ✅ |
| 44 | AK-Gg-LBKAN | 5.8 Kbp | pET28a-AK-Gg.gb | ✅ |
| 45 | CK-Gg-LBKAN | 6.4 Kbp | pET28a-CK-Gg.gb | ✅ |
| 46 | NDK-LBKAN | 5.7 Kbp | pET28a-NDK.gb | ✅ |
| 47 | PPiase-LBKAN | 6.1 Kbp | pET28a-PPiase.gb | ✅ |
| 48 | pT5-T7RNAP-LBKAN | 7.9 Kbp | pET28a | ✅ |
| 49 | EF-Tu-5mL-1 | 6.4 Kbp | pET28a-EFTu.gb | ✅ |
| 50 | EF-Tu-5mL-2 | 6.4 Kbp | pET28a-EFTu.gb | ✅ |
Cell Lysis
We resuspended, lysed, and clarified the co-cultured cell pellet as described in the protocol. Our initial sonication conditions delivered 16.1 kJ total energy across four 15 mL Falcon tubes, for ~4 kJ per tube (Table 2). Based on the color of the pellet during clarification, and data from other experiments we’ve been running, we suspected that the cells were still un-sonicated. To test the effect of further sonication, we resuspended the post-clarification pellet in additional lysis buffer, and ran it through a second sonication round with significantly higher amplitude and total energy delivery (Table 3). Through the subsequent processes, lysate from the first round is designated I, and from the second, II.
Table 2:Sonication conditions for Sample Set I.
| Sonication Round | On [s] | Off [s] | Amplitude [%] | Total Process Time [mm:ss] | Total Energy [kJ] |
|---|---|---|---|---|---|
| 1 | 10 | 30 | 40 | 01:20 | 3.8 |
| 2 | 10 | 30 | 40 | 02:00 | 5.9 |
| 3 | 10 | 30 | 40 | 02:00 | 6.4 |
| Total | 05:20 | 16.1 |
Table 3:Sonication conditions for Sample Set II.
| Sonication Round | On [s] | Off [s] | Amplitude [%] | Total Process Time [mm:ss] | Total Energy [kJ] |
|---|---|---|---|---|---|
| 1 | 10 | 30 | 50 | 03:30 | 12.7 |
| 2 | 10 | 40 | 50 | 02:30 | 9.1 |
| Total | 06:00 | 21.8 |
Protein purification and concentration
We performed gravity-column protein purification, following the protocol. One difference—rather than the Ni-His resin specified in the BOM, we used G-Biosciences Nickel Chelating resin #786-407. We collected fractions from the clarified lysate (supernatant before addition to the column), initial flowthrough (the lysate flowing off the column, after binding), the first of two washes, and the eluent before dilution with dialysis buffer. We then ran a protein gel on these fractions.
We observed the following:
- The wash is very dilute and could have been concentrated. We see very faint bands in Lane 2 (Wash #1 sample
I -) Figure 4. - There is significantly more protein in Samples
IversusII. This is somewhat counterintuitive; it would be good to try these conditions again but both with fresh pellet rather than resuspending a pre-sonicated pellet. It’s possible that the first sonication sufficiently lysed the cells to extract most of the protein, and that observation of the pellet was misleading. - The purified proteins, particularly in eluent, look generally good.
- The darkest (highest concentration) bands are at ~33 kDa. We’d hope this is EF-Tu, but EF-Tu is 43.3 kDa. This could be a combination of MTF (34 kDa), GlyQ (35 kDa), PheS (37 kDa). If this is the case, we have substantially less EF-Tu that we would like, in spite of inoculating the co-culture with a large amount of the EF-Tu strain.
- Quantitation of the putative EF-Tu band for
I +(band at 40.5 kDa) gives 219 ng; 11.4% of detected bands (not all of them) and 5% of detected lane protein.
We concentrated the eluent through three rounds of diafiltration, as described in the protocol. We concentrated down to around 1 mL volume per round, which gives a lower dilution ratio overall but reduces the risk of proteins crashing out as they become highly concentrated. We preferred this trade-off for this experiment to ensure the proteins remained folded in solution. At the final round of concentration, we abandoned the II samples which were still at too low a concentration to be useful, and split the I samples across two 0.5 mL spin filters (Amicon Ultra 3 kDa, UFC500308) so that we could perform the final concentration round with the added glycerol storage buffer at a much higher centrifugation speed.
Through the final rounds of spin concentration, we took indicative protein concentration measurements using nanodrop A280, with the rough rubric of 1A = 1 mg/mL. After the final spin concentration in storage buffer, we aliquoted each sample (16 aliquots per sample protein mix) and stored at -80ºC. We next more accurately determined the concentrations of the protein mix through Pierce660 (Table 4) and Labchip CE assays.
SDS-PAGE Gel Running Conditions
- BioRad Mini-Protean Stain-Free Gel, 4–20% (#4568094).
- Samples diluted 1 in 4 in ddH2O
- Mixed 3 in 4 with 4x reducing laemmli buffer (900 uL 4x laemmli buffer + 100 uL beta-mercaptoethanol)
- Boiled 5 min at 90C
- Loaded 10 uL of each sample plus 10 uL ladder.
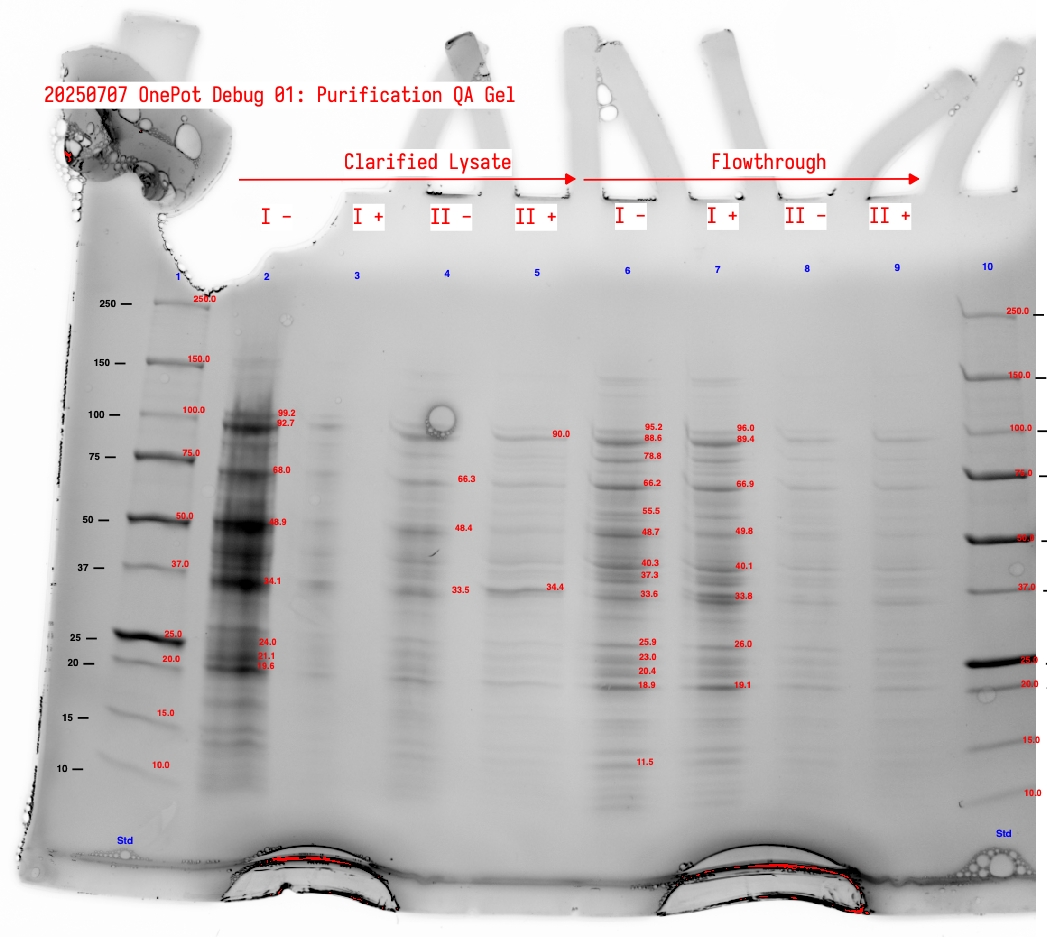
Figure 4:Annotated protein gel showing clarified lysate and flowthrough fractions for sample sets I and II.
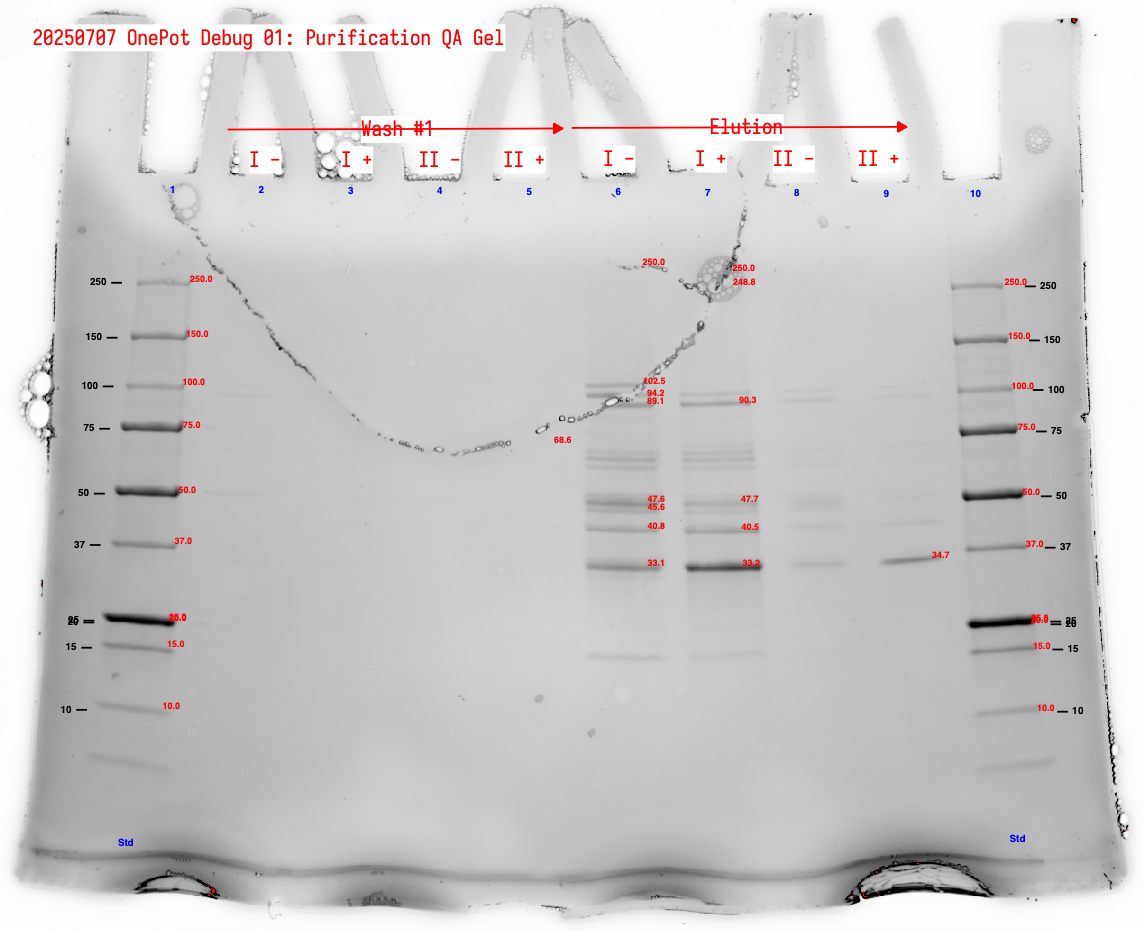
Figure 5:Annotated protein gel showing wash #1 and elution fractions for sample sets I and II.
Table 4:Protein mix concentration by A280 and Pierce 660.
| Method | Sample | Concentration (mg/mL) | A260/A280 |
|---|---|---|---|
| A280 | I - | 9.997 | 0.626 |
| A280 | I + | 13.546 | 0.640 |
| Pierce 660 | I - | 6.66 | |
| Pierce 660 | I + | 10.63 | |
| A280 | II - | 0.992 | 0.709 |
| A280 | II + | 0.883 | 0.737 |
I -First sonication round, no glucoseI +First sonication round, plus 1% glucose in co-cultureII -Second sonication round, no glucoseII +Second sonication round, plus 1% glucose in co-culture
Performance of Protein Mix in PURE Reactions
We tested proteins from Sample Set I in PURE reactions assembled using b.next ribosomes and NEB PURExpress Solution A. Controls were prepared from NEB reagents. Detailed description of experimental conditions are shown in Table 5 and Table 6-Table 8. The results show that, when used with NEB Solution A, this batch of OnePot Protein Mix has a performance ~10–15% relative to the NEB (-) Ribosome control.
Reaction Descriptions
Table 5:Detailed reaction descriptions
| Reaction Name | Description |
|---|---|
I - | Nucleus OnePot Pmix (using co-cultured proteins grown without 1% glucose supplement) (+) b.next Ribosomes |
I + | (using co-cultured proteins grown with 1% glucose supplement) (+) b.next Ribosomes, first replicate |
I + 2 | (using co-cultured proteins grown with 1% glucose supplement) (+) b.next Ribosomes, second replicate |
| NEB delRibo | NEB PURExpress (-) Ribosome (+) b.next Ribosomes |
| NEB POS | NEB PURExpress (+) plamGFP |
| NEB NEG | NEB PURExpress (-) plamGFP |
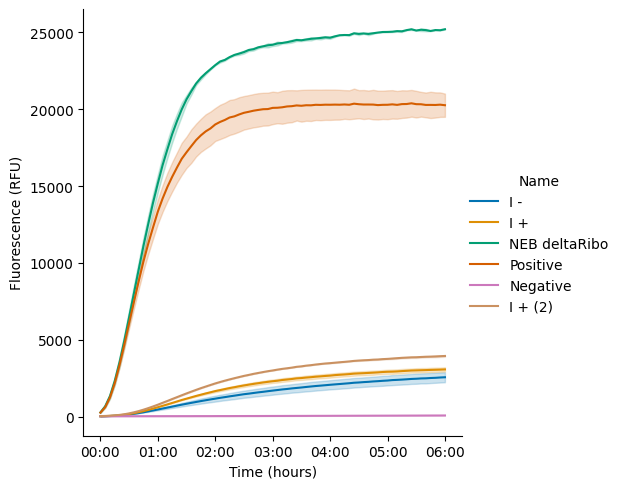
Figure 6:Translation kinetics comparing PURE reactions containing OnePot Protein Mix with PURExpress control reactions. The graph shows plamGFP fluorescence measurements over time.
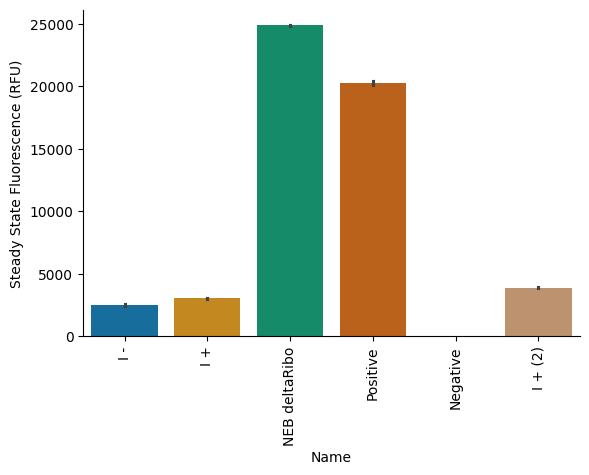
Figure 7:Steady state fluorescence measurements comparing PURE reactions containing OnePot Protein Mix with PURExpress control reactions.
Table 6:Table showing composition of individual reactions testing protein mix (Pmix) including positive (+ve) and negative (-ve) controls. Values shown are volumes in microliters.
| Individual Reactions | |||
|---|---|---|---|
| Pmix | +ve | -ve | |
| NEB Sol A | 4 | 4 | 4 |
| NEB Sol B | 3 | 3 | |
| Pmix | 1.2 | ||
| Ribosomes | 1.8 | ||
| RNAse I | 0.5 | 0.5 | 0.5 |
| plamGFP DNA | 1 | 1 | |
| ddH2O | 1.5 | 1.5 | 2.5 |
| Total | 10 | 10 | 10 |
Table 7:Table showing master mixes used to prepare individual reactions described in Table 6. Values shown are volumes in microliters.
| Master Mixes | |||
|---|---|---|---|
| 3 replicates, 3 Pmixes (I -, I+, NEB delRibo), 1 reaction extra | |||
| Pmix | +ve | -ve | |
| NEB Sol A | 64 | 16 | 16 |
| NEB Sol B | 12 | 12 | |
| Pmix | |||
| Ribosomes | 28.8 | ||
| RNAse I | 8 | 2 | 2 |
| plamGFP DNA | 16 | 4 | |
| ddH2O | 24 | 6 | 10 |
| Total | 140.8 | 40 | 40 |
Table 8:Table showing the assembly of Pmix reactions from master mixes described in Table 7 including the NEB deltaRibo sample to control for the use of self-made ribosomes. Values shown are volumes in microliters.
| Pmix Assemblies | |||
|---|---|---|---|
| I - | I + | NEB deltaRibo | |
| Pmix Master Mix | 35.2 | 35.2 | 35.2 |
| I - Pmix | 4.8 | ||
| I + Pmix | 4.8 | ||
| NEB deltaRibo | 4.8 | ||
| Total | 40 | 40 | 40 |
| Plate in triplicate |
Conclusions and Next Steps
The results here are better than what we achieved in the workshop, but still fall below the performance (50–100%) that we have achieved during other Nucleus OnePot production runs. Given our careful sequencing of the input overnights, the result suggests that something else is going on—either strains are dropping out during co-culture or induction, or there is another process variable that is affecting performance.
We wish to perform further characterization of this batch, using a self-made energy mix, so that we can perform a magnesium concentration sweep. While we would have expected better performance within NEB Solution A, we know that it does not have the optimal magnesium concentration for OnePot protein mix, and therefore we might be able to squeeze higher performance by optimizing.
Beyond that, there are several avenues we are investigating to identify the cause of the low protein mix performance:
- The co-culture may not be resulting in the correct abundances of the 36 target proteins, through strains dropping out, expressing poorly, or mutating during the final culture. Our gel and Labchip analyses point to this as a factor. We’re presently working on methods to test final strain abundances; we would also like to quantitate protein mix abundances through mass spectrometry to more conclusively determine which proteins are present.
- As a related factor, EF-Tu in the protein mix is clearly low. Supplementing purified EF-Tu may increase performance (a “two-pot” PURE).
- The purification resin, as mentioned, might have contaminated the purified proteins with Ni2+. We know PURE is extremely sensitive to metal co-factor concentration, and it’s possible that Ni2+ displaces Mg2+ within key enzymes and thus is less-likely to be diluted out through the rounds of spin concentration.