Contents
Analysis: 20250708
import pandas as pd
import matplotlib.pyplot as plt
import seaborn as sns
import warnings

from cdk.analysis.cytosol import platereader as pr

# Filter warnings
warnings.filterwarnings('ignore')

# Initialize plotting
pr.plot_setup()
Load the data
Provide a CSV file containing the data, and a platemap. This function returns both the data with the plate map mapped to it, and the platemap by itself, which is useful for certain tasks.
data_file = "./20250708-cytation3-pure-timecourse-gfp-onepot-debug-01-pure-test-biotek-cdk.txt"
platemap_file = "./platemap.tsv"

data, platemap = pr.load_platereader_data(data_file, platemap_file)
data = data[data["Row"].isin(["B","D"])]
Basic Analysis
Curves
Curves of RFU over time, by named sample.
pr.plot_curves(data, palette="colorblind");
plt.savefig("20250708-timeseries-exp1")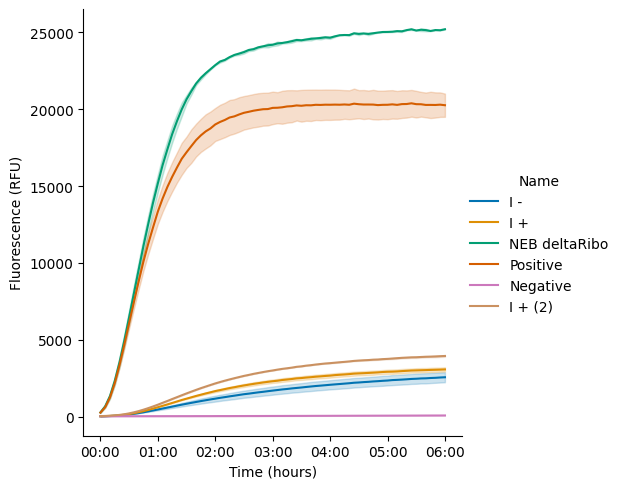
Steady state
Bar graph of steady-state endpoint of each sample. Steady state is calculated as the maximum fluorescence value over a 3-sample rolling average on the data.
pr.plot_steadystate(data, palette="colorblind");
plt.savefig("20250708-endpoint-exp1")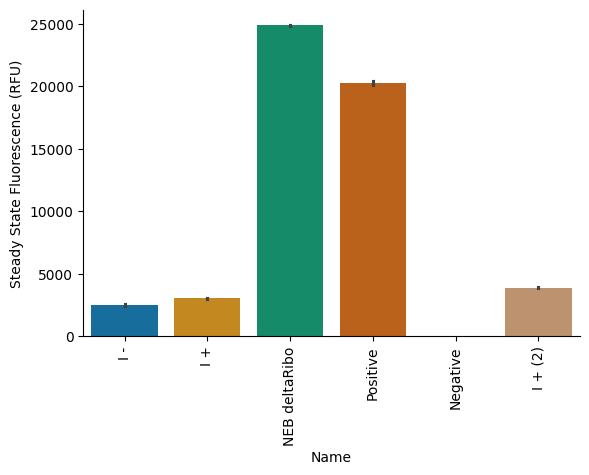
Kinetics
These functions calculate key kinetic parameters of the time series.
pr.plot_kinetics(data)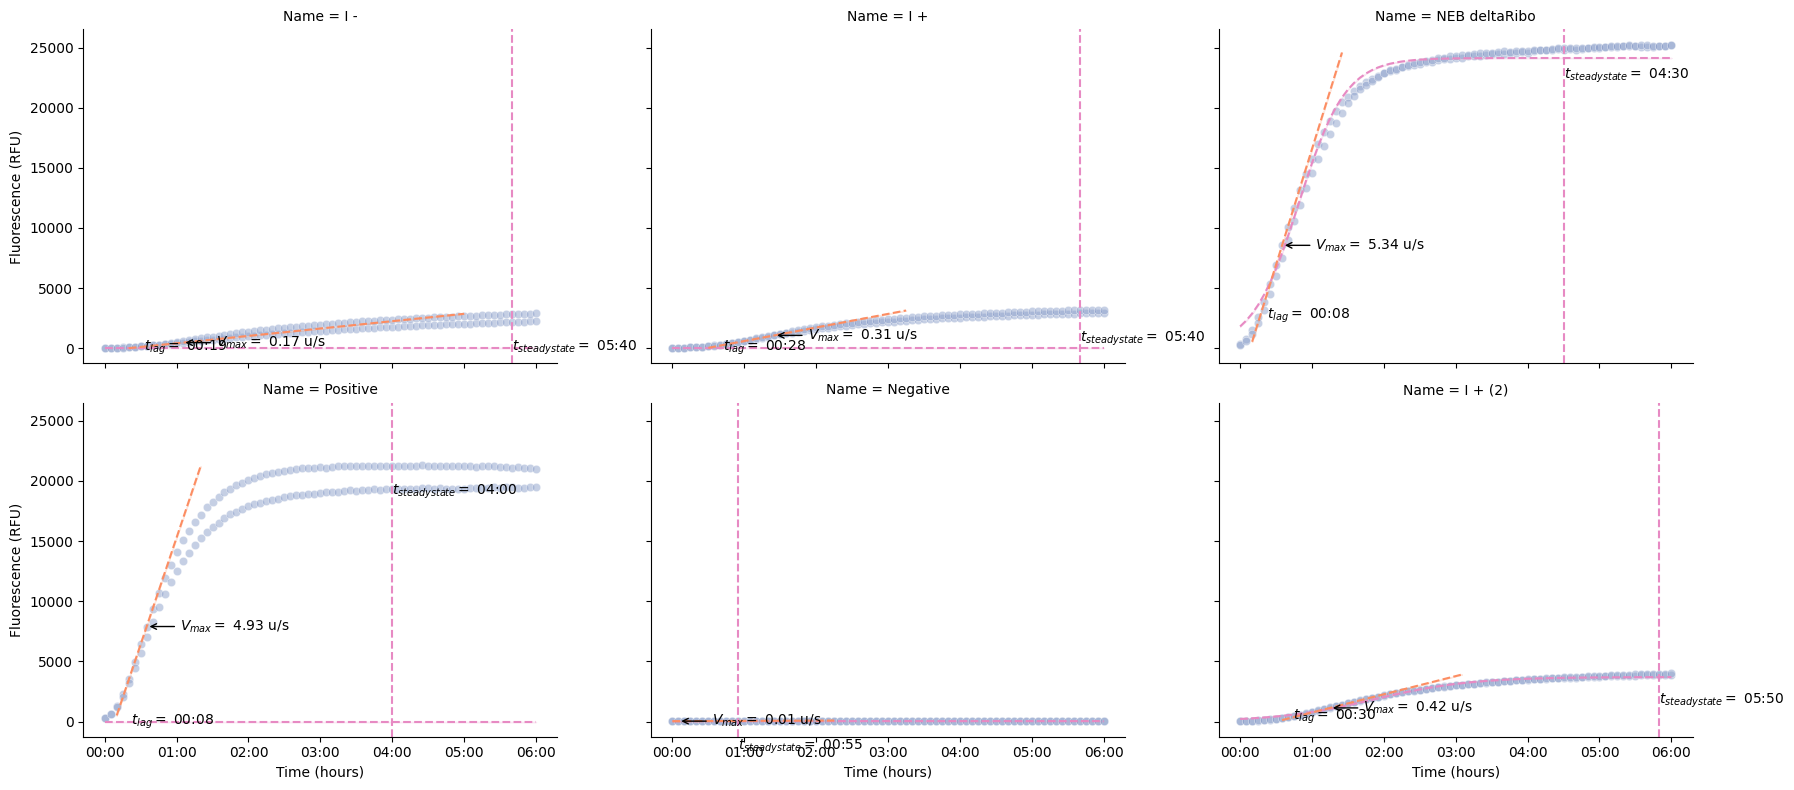
We can also calculate the kinetics and display the parameters as a table.
pr.kinetic_analysis(data) Velocity \
Time Data Max
Well Name Read
B2 I - GFP-F-G35 0 days 01:05:00 467 0.17
B4 I + GFP-F-G35 0 days 01:25:00 1070 0.31
B6 NEB deltaRibo GFP-F-G35 0 days 00:35:00 8556 5.34
B8 Positive GFP-F-G35 0 days 00:35:00 7900 4.93
B10 Negative GFP-F-G35 0 days 00:05:00 33 0.01
B12 I + (2) GFP-F-G35 0 days 01:15:00 1133 0.42
D3 I - GFP-F-G35 0 days 01:05:00 602 0.26
D4 I + GFP-F-G35 0 days 01:15:00 912 0.33
D6 NEB deltaRibo GFP-F-G35 0 days 00:40:00 9021 5.14
D8 Positive GFP-F-G35 0 days 00:30:00 5735 4.36
D10 Negative GFP-F-G35 0 days 00:05:00 36 0.01
D12 I + (2) GFP-F-G35 0 days 01:15:00 1171 0.42
Lag \
Time Data
Well Name Read
B2 I - GFP-F-G35 0 days 00:19:12.941176471 0.00
B4 I + GFP-F-G35 0 days 00:28:05.106382979 0.00
B6 NEB deltaRibo GFP-F-G35 0 days 00:08:18.752339364 2669.52
B8 Positive GFP-F-G35 0 days 00:08:17.565922921 0.00
B10 Negative GFP-F-G35 -1 days +22:42:30 12.47
B12 I + (2) GFP-F-G35 0 days 00:30:02.380952381 424.93
D3 I - GFP-F-G35 0 days 00:25:54.545454545 311.15
D4 I + GFP-F-G35 0 days 00:29:24 347.76
D6 NEB deltaRibo GFP-F-G35 0 days 00:10:43.802725503 2710.19
D8 Positive GFP-F-G35 0 days 00:08:04.633027523 0.00
D10 Negative GFP-F-G35 -1 days +22:35:00 0.00
D12 I + (2) GFP-F-G35 0 days 00:28:31.904761905 446.01
Steady State Fit
Time Data L k x0
Well Name Read
B2 I - GFP-F-G35 0 days 05:40:00 2169 0.00 0.00 0.00
B4 I + GFP-F-G35 0 days 05:40:00 2898 0.00 0.00 0.00
B6 NEB deltaRibo GFP-F-G35 0 days 04:30:00 24812 24130.36 0.00 2937.00
B8 Positive GFP-F-G35 0 days 04:00:00 21275 0.00 0.00 0.00
B10 Negative GFP-F-G35 0 days 00:55:00 36 37.89 0.00 -3222.04
B12 I + (2) GFP-F-G35 0 days 05:50:00 3866 3705.53 0.00 6714.75
D3 I - GFP-F-G35 0 days 05:50:00 2856 2739.64 0.00 7721.68
D4 I + GFP-F-G35 0 days 05:45:00 3185 3033.19 0.00 6847.01
D6 NEB deltaRibo GFP-F-G35 0 days 04:45:00 24975 24408.85 0.00 3229.30
D8 Positive GFP-F-G35 0 days 04:00:00 19300 0.00 0.00 0.00
D10 Negative GFP-F-G35 0 days 00:30:00 37 37.35 0.00 -700.59
D12 I + (2) GFP-F-G35 0 days 05:45:00 3952 3778.58 0.00 6818.50