Contents
Analysis: 20250613
!pip install nucleus-cdk | tail -n2from cdk.analysis.cytosol import platereader as pr
import matplotlib.pyplot as plt
import warnings
# Filter warnings
warnings.filterwarnings('ignore')
# Initialize plotting
pr.plot_setup()Load the data
Provide a CSV file containing the data, and a platemap. This function returns both the data with the plate map mapped to it, and the platemap by itself, which is useful for certain tasks.
data, platemap = pr.load_platereader_data("./data/20250613-cytation3-pure-timecourse-gfp-EXPERIMENT-biotek-cdk.txt", "20250613-PPK Mg Opt platemap.csv")Basic Plots
Kinetics
Kinetic time traces of every well on the plate
pr.plot_curves(data);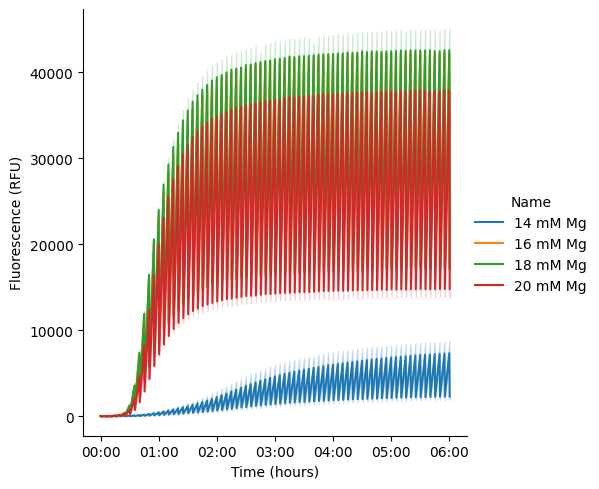
Steady state
Bar graph of steady-state endpoint of each sample. Steady state is calculated as the maximum fluorescence value over a 3-sample rolling average on the data.
replace_dict = {'14 mM Mg':'14 mM',
                '16 mM Mg':'16 mM',
                '18 mM Mg':'18 mM',
                '20 mM Mg':'20 mM',
               }

data['Name'] = data['Name'].replace(replace_dict)

p = pr.plot_steadystate(data,)
plt.xlabel('[Mg++]')
p.savefig("plot7")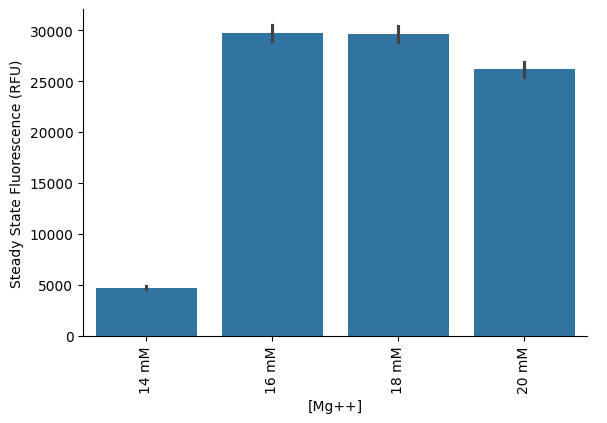
Kinetics Analysis
These functions calculate key kinetic parameters of the time series.
pr.plot_kinetics(data)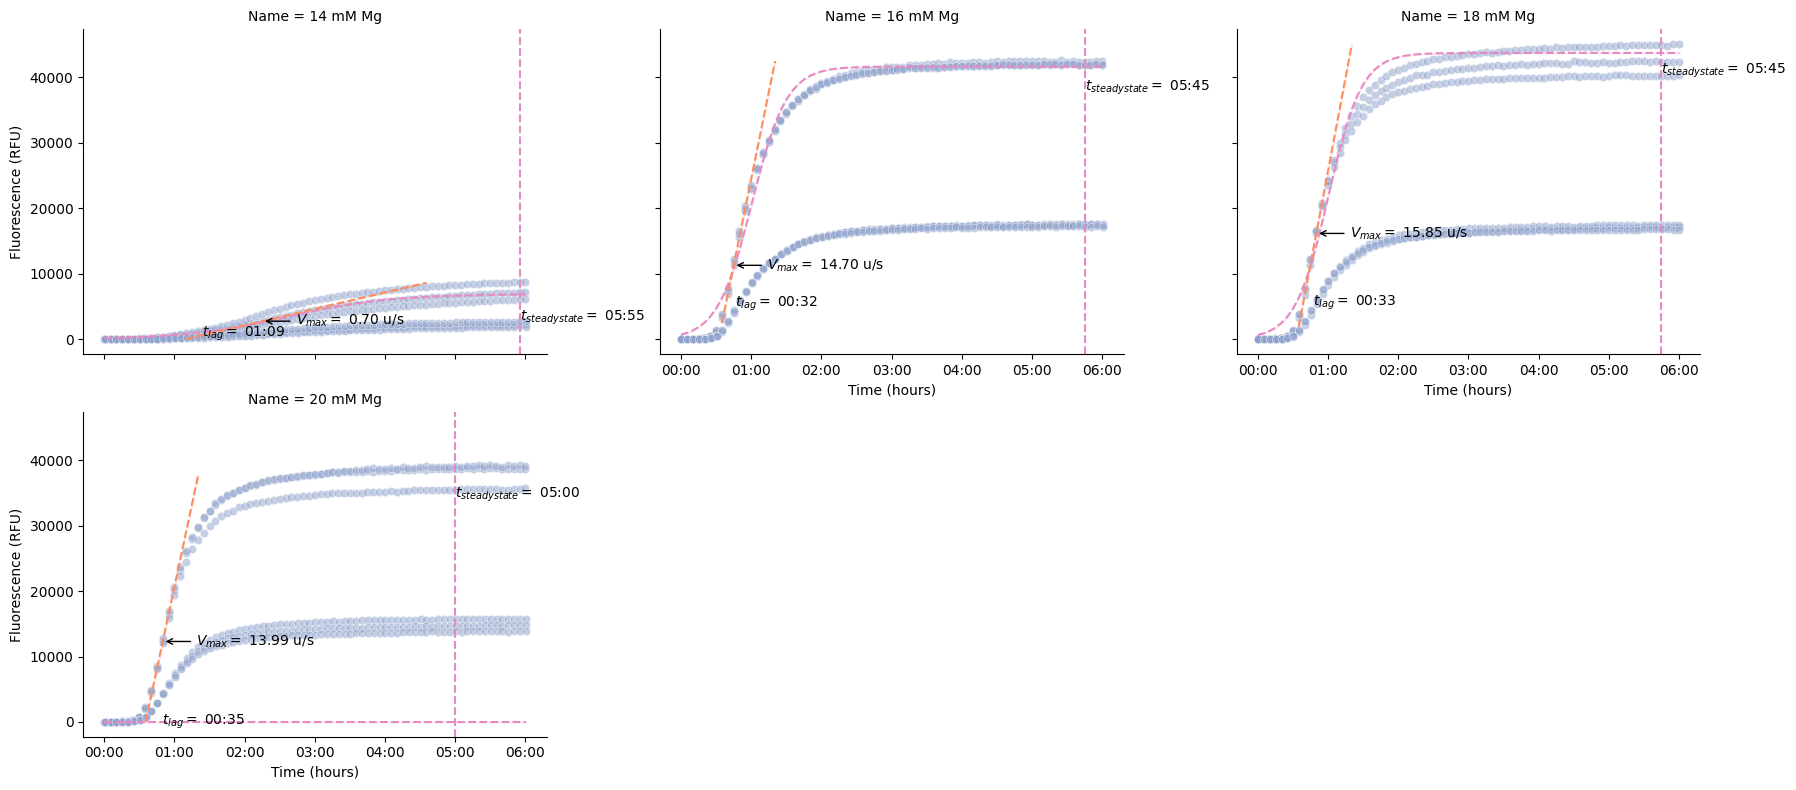
We can also calculate the kinetics and display the parameters as a table.
pr.kinetic_analysis(data) Velocity \
Time Data Max
Well Name Read
I1 14 mM Mg GFP-F-G35 0 days 02:15:00 2744 0.70
I4 14 mM Mg GFP-F-G35 0 days 02:25:00 2433 0.61
I7 14 mM Mg GFP-F-G35 0 days 02:15:00 3828 0.98
K1 16 mM Mg GFP-F-G35 0 days 00:45:00 11282 14.70
K4 16 mM Mg GFP-F-G35 0 days 00:45:00 11818 14.84
K7 16 mM Mg GFP-F-G35 0 days 00:45:00 12246 14.85
M1 18 mM Mg GFP-F-G35 0 days 00:50:00 16157 15.85
M4 18 mM Mg GFP-F-G35 0 days 00:45:00 12080 15.24
M7 18 mM Mg GFP-F-G35 0 days 00:45:00 12256 14.90
O1 20 mM Mg GFP-F-G35 0 days 00:50:00 12303 13.99
O4 20 mM Mg GFP-F-G35 0 days 00:50:00 12852 14.08
O7 20 mM Mg GFP-F-G35 0 days 00:50:00 12101 12.96
I1 14 mM Mg GFP-M-G100 0 days 02:25:23 986 0.27
I4 14 mM Mg GFP-M-G100 0 days 02:20:23 712 0.21
I7 14 mM Mg GFP-M-G100 0 days 02:35:23 1500 0.35
K1 16 mM Mg GFP-M-G100 0 days 00:50:23 5674 5.53
K4 16 mM Mg GFP-M-G100 0 days 00:50:23 5815 5.50
K7 16 mM Mg GFP-M-G100 0 days 00:45:23 4393 5.35
M1 18 mM Mg GFP-M-G100 0 days 00:50:23 5364 5.57
M4 18 mM Mg GFP-M-G100 0 days 00:50:23 5999 5.73
M7 18 mM Mg GFP-M-G100 0 days 00:50:23 6122 5.48
O1 20 mM Mg GFP-M-G100 0 days 00:50:23 4475 5.16
O4 20 mM Mg GFP-M-G100 0 days 00:55:23 5861 5.03
O7 20 mM Mg GFP-M-G100 0 days 00:55:23 5665 4.75
Lag Steady State \
Time Data Time
Well Name Read
I1 14 mM Mg GFP-F-G35 0 days 01:09:21.244019139 805.23 0 days 05:55:00
I4 14 mM Mg GFP-F-G35 0 days 01:18:31.475409836 730.85 0 days 05:45:00
I7 14 mM Mg GFP-F-G35 0 days 01:09:53.877551020 1016.50 0 days 05:45:00
K1 16 mM Mg GFP-F-G35 0 days 00:32:12.517006803 5335.04 0 days 05:45:00
K4 16 mM Mg GFP-F-G35 0 days 00:31:43.459896652 5312.84 0 days 05:25:00
K7 16 mM Mg GFP-F-G35 0 days 00:31:15.168387966 0.00 0 days 05:00:00
M1 18 mM Mg GFP-F-G35 0 days 00:33:00.630914826 5593.24 0 days 05:45:00
M4 18 mM Mg GFP-F-G35 0 days 00:31:47.175672719 5181.14 0 days 05:05:00
M7 18 mM Mg GFP-F-G35 0 days 00:31:17.633639007 4758.06 0 days 03:55:00
O1 20 mM Mg GFP-F-G35 0 days 00:35:20.586132952 0.00 0 days 05:00:00
O4 20 mM Mg GFP-F-G35 0 days 00:34:47.431952663 4778.50 0 days 05:15:00
O7 20 mM Mg GFP-F-G35 0 days 00:34:26.280864198 0.00 0 days 05:00:00
I1 14 mM Mg GFP-M-G100 0 days 01:24:31.148148148 329.92 0 days 05:40:23
I4 14 mM Mg GFP-M-G100 0 days 01:24:45.500000 254.78 0 days 05:35:23
I7 14 mM Mg GFP-M-G100 0 days 01:23:16.076923077 419.53 0 days 05:55:23
K1 16 mM Mg GFP-M-G100 0 days 00:33:16.960216998 2067.55 0 days 03:50:23
K4 16 mM Mg GFP-M-G100 0 days 00:32:45.727272727 2212.41 0 days 05:55:23
K7 16 mM Mg GFP-M-G100 0 days 00:31:41.878504673 2090.98 0 days 05:20:23
M1 18 mM Mg GFP-M-G100 0 days 00:34:19.407185629 2126.31 0 days 05:20:23
M4 18 mM Mg GFP-M-G100 0 days 00:32:55.444703143 2025.78 0 days 03:50:23
M7 18 mM Mg GFP-M-G100 0 days 00:31:45.166768107 1918.59 0 days 03:55:23
O1 20 mM Mg GFP-M-G100 0 days 00:35:56.311814074 1897.37 0 days 05:25:23
O4 20 mM Mg GFP-M-G100 0 days 00:35:57.791252485 1865.38 0 days 06:00:23
O7 20 mM Mg GFP-M-G100 0 days 00:35:31.204768583 1623.32 0 days 04:05:23
Fit
Data L k x0
Well Name Read
I1 14 mM Mg GFP-F-G35 7147 6897.89 0.00 9425.31
I4 14 mM Mg GFP-F-G35 5984 5836.42 0.00 9868.93
I7 14 mM Mg GFP-F-G35 8629 8336.01 0.00 8704.02
K1 16 mM Mg GFP-F-G35 42421 41658.93 0.00 3639.51
K4 16 mM Mg GFP-F-G35 42000 41136.98 0.00 3592.56
K7 16 mM Mg GFP-F-G35 41938 0.00 0.00 0.00
M1 18 mM Mg GFP-F-G35 44922 43745.45 0.00 3621.87
M4 18 mM Mg GFP-F-G35 42275 41300.79 0.00 3505.20
M7 18 mM Mg GFP-F-G35 39909 38874.28 0.00 3404.86
O1 20 mM Mg GFP-F-G35 38607 0.00 0.00 0.00
O4 20 mM Mg GFP-F-G35 39087 37983.89 0.00 3651.64
O7 20 mM Mg GFP-F-G35 35494 0.00 0.00 0.00
I1 14 mM Mg GFP-M-G100 2197 2135.51 0.00 9393.30
I4 14 mM Mg GFP-M-G100 1872 1836.19 0.00 9868.21
I7 14 mM Mg GFP-M-G100 2716 2607.12 0.00 8903.80
K1 16 mM Mg GFP-M-G100 17285 16736.26 0.00 3812.93
K4 16 mM Mg GFP-M-G100 17531 17109.87 0.00 3878.75
K7 16 mM Mg GFP-M-G100 17195 16773.43 0.00 3794.67
M1 18 mM Mg GFP-M-G100 17054 16483.07 0.00 3849.21
M4 18 mM Mg GFP-M-G100 17153 16611.37 0.00 3684.49
M7 18 mM Mg GFP-M-G100 16590 16036.88 0.00 3612.75
O1 20 mM Mg GFP-M-G100 15717 15299.01 0.00 3874.41
O4 20 mM Mg GFP-M-G100 14793 14336.05 0.00 3832.50
O7 20 mM Mg GFP-M-G100 13669 13204.54 0.00 3713.03