Contents
Analysis: 20250616
!pip install nucleus-cdk | tail -n2from cdk.analysis.cytosol import platereader as pr
import matplotlib.pyplot as plt
import warnings
# Filter warnings
warnings.filterwarnings('ignore')
# Initialize plotting
pr.plot_setup()Load the data
Provide a CSV file containing the data, and a platemap. This function returns both the data with the plate map mapped to it, and the platemap by itself, which is useful for certain tasks.
data, platemap = pr.load_platereader_data("./data/20250616-160504-cytation5-pure-timecourse-gfp-ppk-cp-biotek-cdk.txt", "20250616-PPK CP-CK platemap.csv")Basic Plots
Kinetics
Kinetic time traces of every well on the plate
p = pr.plot_curves(data, palette="colorblind")
p.savefig("plot1-timeseries")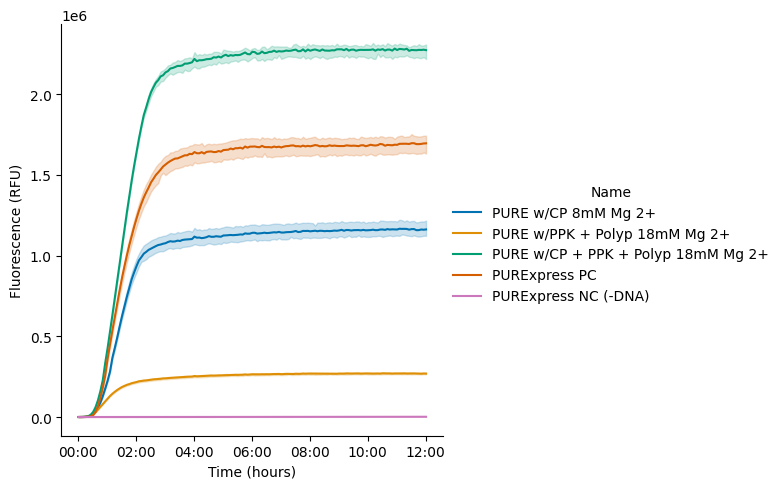
Steady state
Bar graph of steady-state endpoint of each sample. Steady state is calculated as the maximum fluorescence value over a 3-sample rolling average on the data.
p1= pr.plot_steadystate(data, palette="colorblind")
plt.xlabel("Condition")
p1.savefig("plot2-endpoint")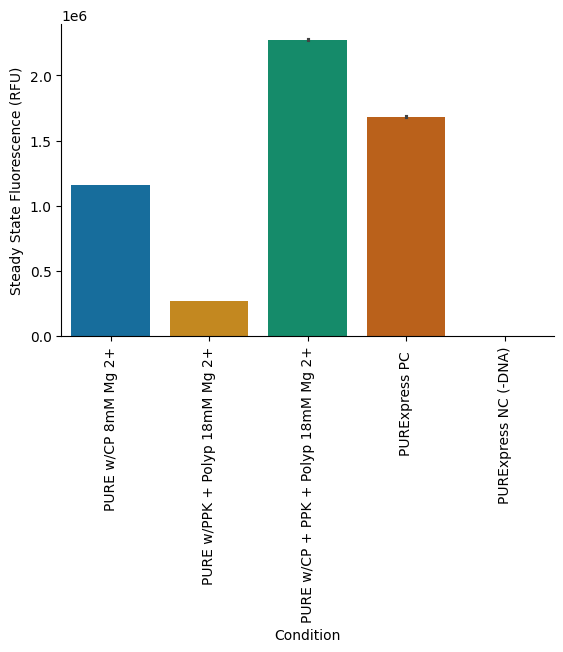
Kinetics Analysis
These functions calculate key kinetic parameters of the time series.
pr.plot_kinetics(data)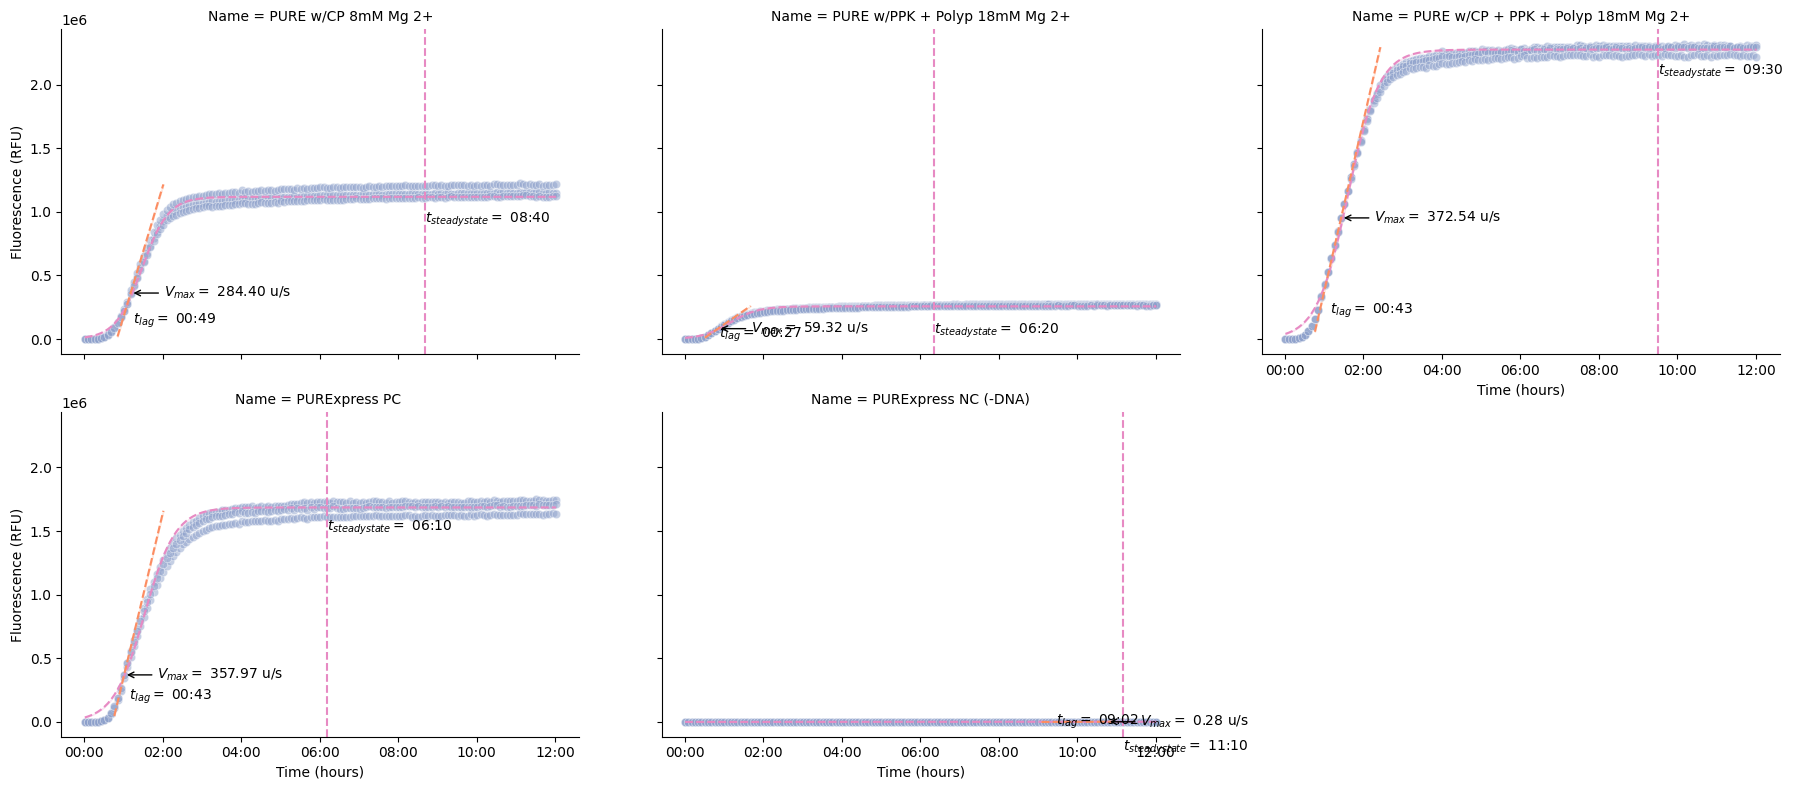
We can also calculate the kinetics and display the parameters as a table.
pr.kinetic_analysis(data) Velocity \
Time Data
Well Name Read
A1 PURE w/CP 8mM Mg 2+ GFP-Gext 0 days 01:10:54 362127
A4 PURE w/CP 8mM Mg 2+ GFP-Gext 0 days 01:10:54 384479
A7 PURE w/CP 8mM Mg 2+ GFP-Gext 0 days 01:10:54 357826
E1 PURE w/PPK + Polyp 18mM Mg 2+ GFP-Gext 0 days 00:50:54 82369
E4 PURE w/PPK + Polyp 18mM Mg 2+ GFP-Gext 0 days 00:50:54 80256
E7 PURE w/PPK + Polyp 18mM Mg 2+ GFP-Gext 0 days 00:55:54 96270
G1 PURE w/CP + PPK + Polyp 18mM Mg 2+ GFP-Gext 0 days 01:25:54 952365
G4 PURE w/CP + PPK + Polyp 18mM Mg 2+ GFP-Gext 0 days 01:20:54 850295
G7 PURE w/CP + PPK + Polyp 18mM Mg 2+ GFP-Gext 0 days 01:25:54 953179
I1 PURExpress PC GFP-Gext 0 days 01:00:54 369875
I4 PURExpress PC GFP-Gext 0 days 01:00:54 343445
I7 PURExpress PC GFP-Gext 0 days 01:00:54 370750
K1 PURExpress NC (-DNA) GFP-Gext 0 days 10:45:54 1759
K4 PURExpress NC (-DNA) GFP-Gext 0 days 10:15:54 1747
K7 PURExpress NC (-DNA) GFP-Gext 0 days 06:50:54 1027
\
Max
Well Name Read
A1 PURE w/CP 8mM Mg 2+ GFP-Gext 284.40
A4 PURE w/CP 8mM Mg 2+ GFP-Gext 296.17
A7 PURE w/CP 8mM Mg 2+ GFP-Gext 283.33
E1 PURE w/PPK + Polyp 18mM Mg 2+ GFP-Gext 59.32
E4 PURE w/PPK + Polyp 18mM Mg 2+ GFP-Gext 58.73
E7 PURE w/PPK + Polyp 18mM Mg 2+ GFP-Gext 58.72
G1 PURE w/CP + PPK + Polyp 18mM Mg 2+ GFP-Gext 372.54
G4 PURE w/CP + PPK + Polyp 18mM Mg 2+ GFP-Gext 368.12
G7 PURE w/CP + PPK + Polyp 18mM Mg 2+ GFP-Gext 375.10
I1 PURExpress PC GFP-Gext 357.97
I4 PURExpress PC GFP-Gext 334.70
I7 PURExpress PC GFP-Gext 356.87
K1 PURExpress NC (-DNA) GFP-Gext 0.28
K4 PURExpress NC (-DNA) GFP-Gext 0.38
K7 PURExpress NC (-DNA) GFP-Gext 0.25
Lag \
Time
Well Name Read
A1 PURE w/CP 8mM Mg 2+ GFP-Gext 0 days 00:49:40.683388225
A4 PURE w/CP 8mM Mg 2+ GFP-Gext 0 days 00:49:15.815419246
A7 PURE w/CP 8mM Mg 2+ GFP-Gext 0 days 00:49:51.069847881
E1 PURE w/PPK + Polyp 18mM Mg 2+ GFP-Gext 0 days 00:27:45.368361899
E4 PURE w/PPK + Polyp 18mM Mg 2+ GFP-Gext 0 days 00:28:07.475225609
E7 PURE w/PPK + Polyp 18mM Mg 2+ GFP-Gext 0 days 00:28:34.617585287
G1 PURE w/CP + PPK + Polyp 18mM Mg 2+ GFP-Gext 0 days 00:43:17.612823564
G4 PURE w/CP + PPK + Polyp 18mM Mg 2+ GFP-Gext 0 days 00:42:24.189882014
G7 PURE w/CP + PPK + Polyp 18mM Mg 2+ GFP-Gext 0 days 00:43:32.844386780
I1 PURExpress PC GFP-Gext 0 days 00:43:40.752644517
I4 PURExpress PC GFP-Gext 0 days 00:43:47.861904809
I7 PURExpress PC GFP-Gext 0 days 00:43:35.106285202
K1 PURExpress NC (-DNA) GFP-Gext 0 days 09:02:25.764705882
K4 PURExpress NC (-DNA) GFP-Gext 0 days 08:59:56.608695652
K7 PURExpress NC (-DNA) GFP-Gext 0 days 05:42:26
Steady State \
Data Time
Well Name Read
A1 PURE w/CP 8mM Mg 2+ GFP-Gext 143518.90 0 days 08:40:54
A4 PURE w/CP 8mM Mg 2+ GFP-Gext 151322.36 0 days 09:50:54
A7 PURE w/CP 8mM Mg 2+ GFP-Gext 147590.20 0 days 10:55:54
E1 PURE w/PPK + Polyp 18mM Mg 2+ GFP-Gext 32386.49 0 days 06:20:54
E4 PURE w/PPK + Polyp 18mM Mg 2+ GFP-Gext 37029.58 0 days 10:15:54
E7 PURE w/PPK + Polyp 18mM Mg 2+ GFP-Gext 35681.92 0 days 08:35:54
G1 PURE w/CP + PPK + Polyp 18mM Mg 2+ GFP-Gext 222646.23 0 days 09:30:54
G4 PURE w/CP + PPK + Polyp 18mM Mg 2+ GFP-Gext 216231.77 0 days 08:25:54
G7 PURE w/CP + PPK + Polyp 18mM Mg 2+ GFP-Gext 223530.14 0 days 09:45:54
I1 PURExpress PC GFP-Gext 195172.90 0 days 06:10:54
I4 PURExpress PC GFP-Gext 193805.11 0 days 10:55:54
I7 PURExpress PC GFP-Gext 201723.39 0 days 09:35:54
K1 PURExpress NC (-DNA) GFP-Gext 1422.66 0 days 11:10:54
K4 PURExpress NC (-DNA) GFP-Gext 1461.34 0 days 10:45:54
K7 PURExpress NC (-DNA) GFP-Gext 842.50 0 days 08:50:54
Fit \
Data L k
Well Name Read
A1 PURE w/CP 8mM Mg 2+ GFP-Gext 1141692 1118114.75 0.00
A4 PURE w/CP 8mM Mg 2+ GFP-Gext 1211545 1181926.27 0.00
A7 PURE w/CP 8mM Mg 2+ GFP-Gext 1122529 1092264.91 0.00
E1 PURE w/PPK + Polyp 18mM Mg 2+ GFP-Gext 270867 258053.10 0.00
E4 PURE w/PPK + Polyp 18mM Mg 2+ GFP-Gext 271459 261643.39 0.00
E7 PURE w/PPK + Polyp 18mM Mg 2+ GFP-Gext 261839 251602.56 0.00
G1 PURE w/CP + PPK + Polyp 18mM Mg 2+ GFP-Gext 2303875 2274585.00 0.00
G4 PURE w/CP + PPK + Polyp 18mM Mg 2+ GFP-Gext 2292580 2248979.45 0.00
G7 PURE w/CP + PPK + Polyp 18mM Mg 2+ GFP-Gext 2231915 2202803.16 0.00
I1 PURExpress PC GFP-Gext 1726680 1685517.17 0.00
I4 PURExpress PC GFP-Gext 1627332 1602115.13 0.00
I7 PURExpress PC GFP-Gext 1690883 1668860.26 0.00
K1 PURExpress NC (-DNA) GFP-Gext 1710 2743.32 0.00
K4 PURExpress NC (-DNA) GFP-Gext 1708 2761.53 0.00
K7 PURExpress NC (-DNA) GFP-Gext 1272 2271.43 0.00
x0
Well Name Read
A1 PURE w/CP 8mM Mg 2+ GFP-Gext 5295.46
A4 PURE w/CP 8mM Mg 2+ GFP-Gext 5288.21
A7 PURE w/CP 8mM Mg 2+ GFP-Gext 5303.17
E1 PURE w/PPK + Polyp 18mM Mg 2+ GFP-Gext 4169.44
E4 PURE w/PPK + Polyp 18mM Mg 2+ GFP-Gext 4380.71
E7 PURE w/PPK + Polyp 18mM Mg 2+ GFP-Gext 4306.29
G1 PURE w/CP + PPK + Polyp 18mM Mg 2+ GFP-Gext 5794.32
G4 PURE w/CP + PPK + Polyp 18mM Mg 2+ GFP-Gext 5755.82
G7 PURE w/CP + PPK + Polyp 18mM Mg 2+ GFP-Gext 5700.34
I1 PURExpress PC GFP-Gext 5513.97
I4 PURExpress PC GFP-Gext 5642.88
I7 PURExpress PC GFP-Gext 5584.27
K1 PURExpress NC (-DNA) GFP-Gext 31428.78
K4 PURExpress NC (-DNA) GFP-Gext 30642.90
K7 PURExpress NC (-DNA) GFP-Gext 28142.75